The Time Toolbar
The Time Toolbar contains icons with options that apply to the Time Calendar view in which they appear. From the Time Toolbar, you can select how you want the Time Calendar view to appear. This menu is opened by clicking the icons: Report, Demand Information, Advanced Settings, View, and Help. |
The Icons of the Time Toolbar
|
Calendar Reports
Clicking on the Report tabs in the drop-down menu will take you to the Time Calendar Report page.
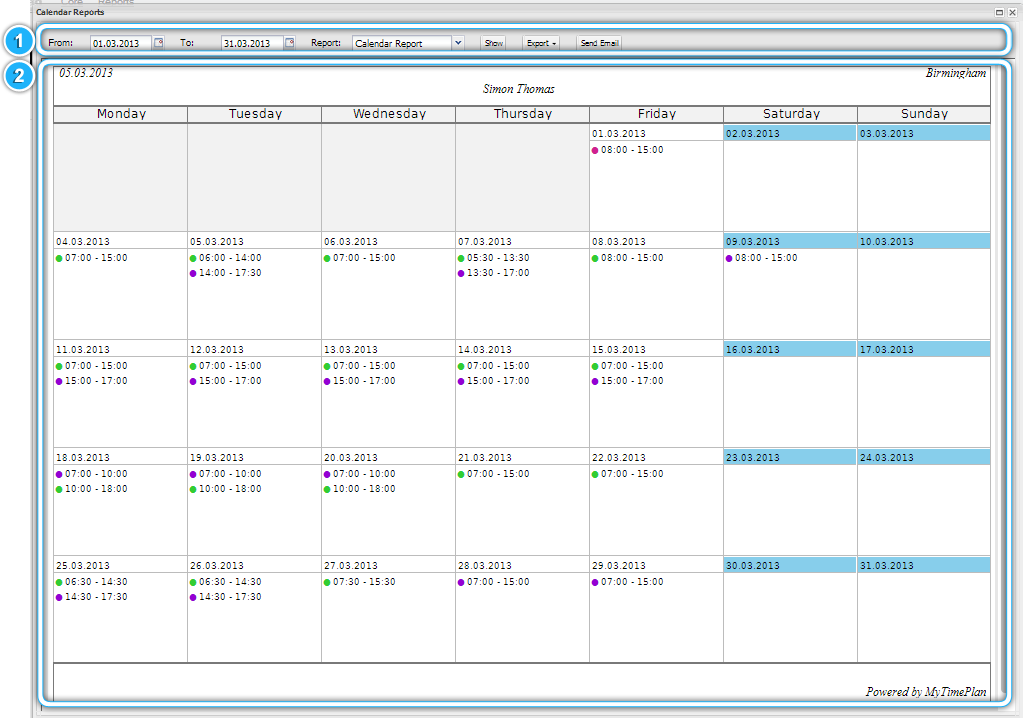 |
1. The Calendar Report Toolbar |
|
The Calendar Report Toolbar provides you with options such as the Time Period filter, the Report Type menu, the Export to different file type, the Send Report by E-mail.
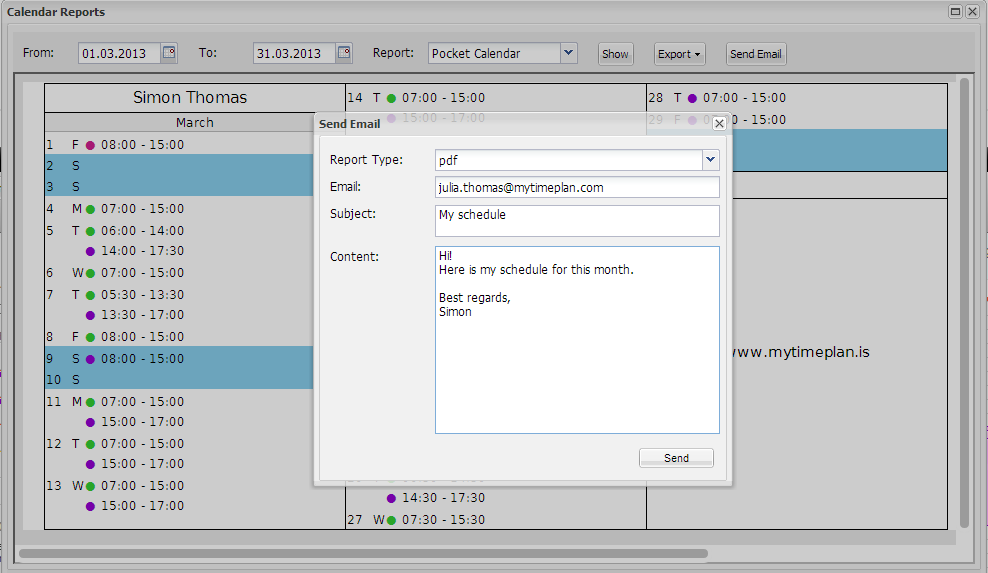 |
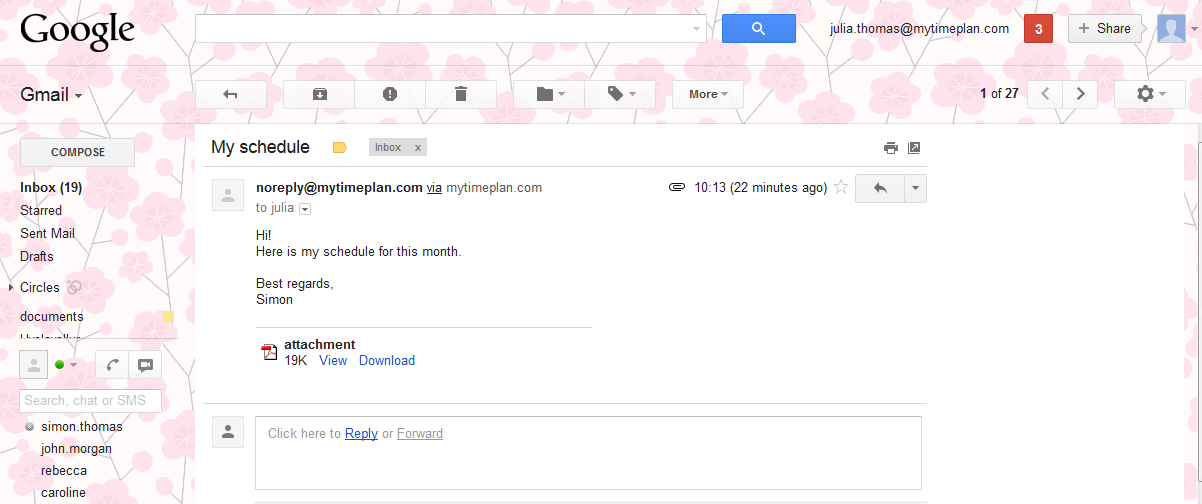
Your E-mail message will look like this
 |
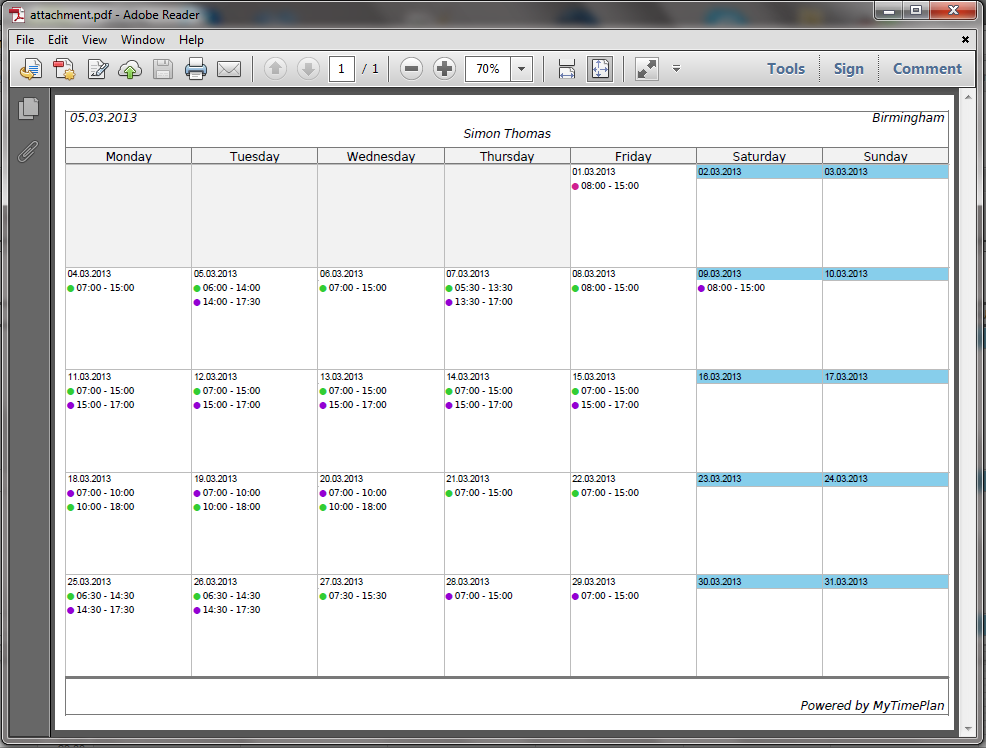
Your Attachment will look like this
 |
2. The Calendar Report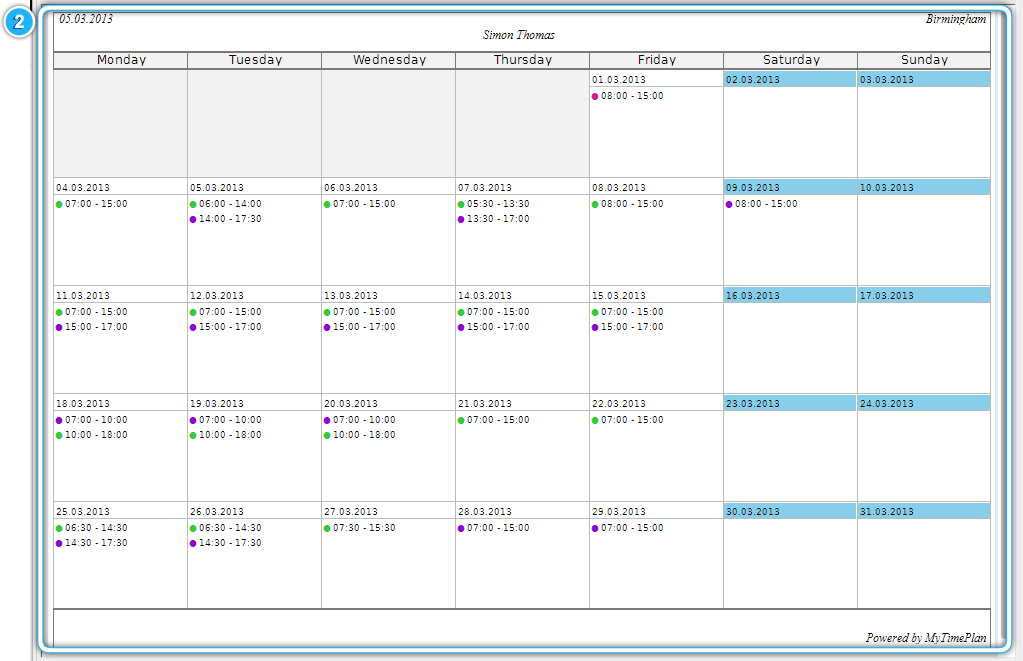 In the Calendar Report you can see your shifts which are displayed as coloured dots. The colours show what type of work you will be doing during that shift, with each type of work having its own colour. |
The Pocket Calendar Report
In the Pocket Calendar Report, you can see the short-hand version of the Schedule Report. You can print it as a credit card sized timetable, which you can then keep in your wallet. 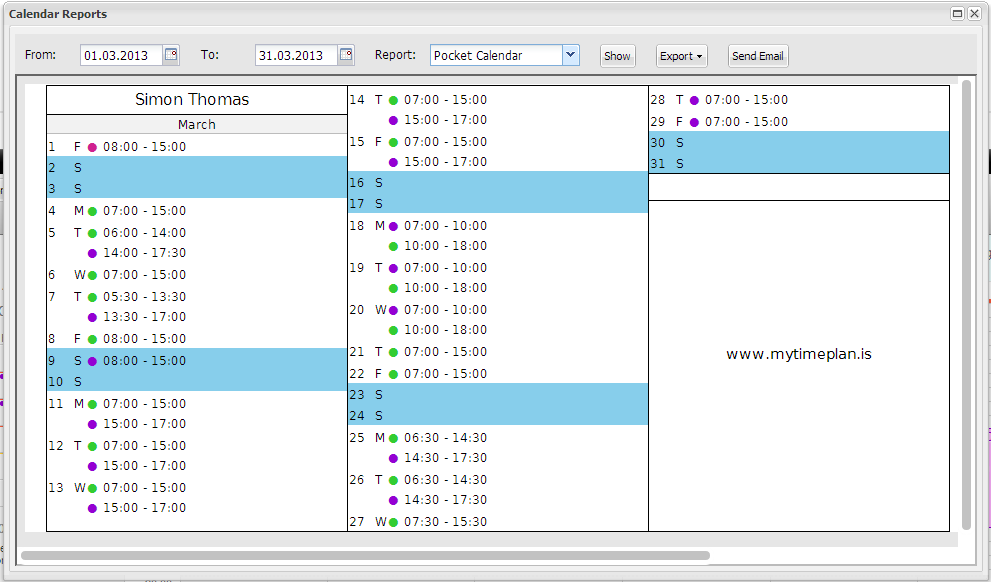 |
Demand Information
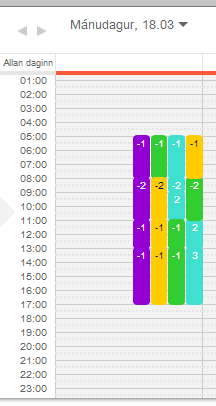
The Demand Information is displayed in the Time Calendar. The Demand Information is a short-hand version of the demand which is in the Time Management Tab > Planning and Attendance or in the Demand Tab. This option applies to display in the Time Calendar view as the Demand Bars with number of employees that are working on one job at one time.
|
|
The demand can be represented by three values, such as below 0, 0 or over 0. It is giving you information about demand, such as
|
 |
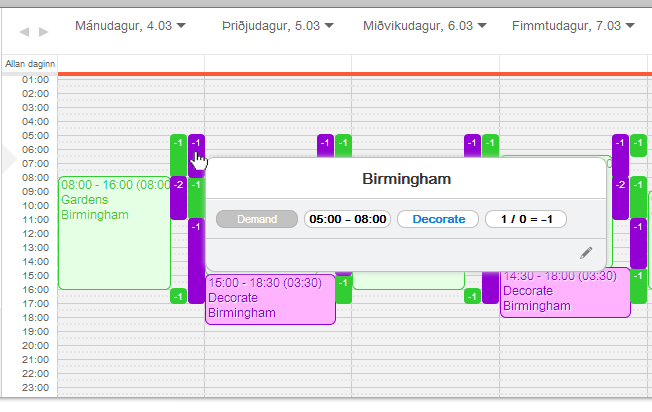
If you select The Demand Information Tab, your Demand ToolTip Information will look like this
 |
|
The Demand Information window appears as a ToolTip when you hover your mouse over the Demand Bar. This window shows you the minimum range of Demand for a particular job, and also an at-a-glance view of the staff numbers working at that particular time. At the end we have an amount of demand (under-staffed or over-staffed). As you can see above, on the 04.03.2013 between 05:00-08:00 for job Decorate, there is a minimum staff Demand of 1, and at that time, we have 0 staff members at present work, our demand value is equal -1. We are under-staffed for Decorating.
Note: – The Demand Bars display how many people should be completing a job at any given time. – The Demand Information Tab is changing colour when is working – If you want to see the details for one job you have to change the settings on the Time Toolbar>Advanced Settings, and select the jobs you want to see. – Click on the Time Toolbar >Advanced Settings >Show Over-staffed Demand Tab if you want to see over-staffed demand. – Well planned demand appears in the Plan Calendar view as the Demand Bar with 0 value on it. |
Advanced Settings
The Advanced Settings Tab allows you to see more demand details. Clicking on the Show Over-staffed Demand Tab, will apply to display over-staffed demand in the Time Calendar View. If you want to see the details for one job you have to select the jobs you want to see in the Time Calendar View be clicking on the Advanced Settings Job’s list. |
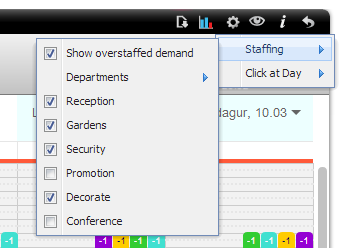 |
The Show Over-staffed Demand Tab
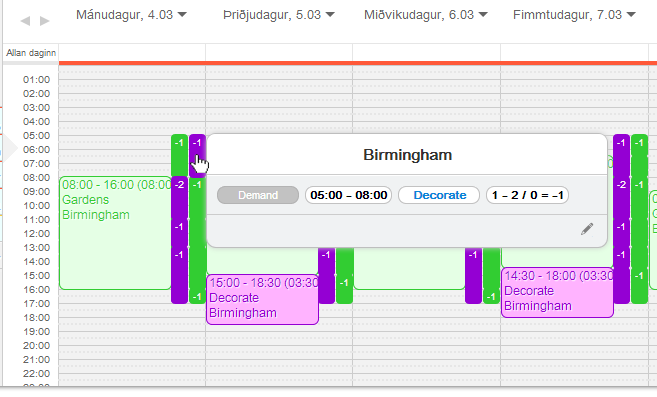
If you select The Show Over-staffed Demand Tab, your Demand ToolTip Information will look like this
 |
|
The Demand Information window appears as a ToolTip when you hover your mouse over the Demand Bar.
This window shows you the minimum to maximum range of Demand for a particular job, and also an at-a-glance view of the staff numbers working at that particular time. At the end we have an amount of demand (under-staffed or over-staffed).
As you can see above, on the 04.03.2013 between 05:00-08:00 for job Decorate, there is a minimum staff Demand of 1, and a maximum Demand of 2. At that time, we have 0 staff members present, our demand value is equal -1. We are under-staffed for Decorating.
Note:
– The Demand Bars display how many people should be completing a job at any given time. – Click on The Demand Information Tab to see the Demand Bars in the Time Calendar View. The Demand Information Tab is changing colour when is working – If you want to see the details for one job you have to change the settings on the Time Toolbar>Advanced Settings, and select the jobs you want to see. – Click on the Time Toolbar>Advanced Settings >Show Over-staffed Demand Tab if you want to see overstaffed demand. – Well planned demand appears in the Time Calendar view as the Demand Bar with 0 value on it. |
Advanced Settings > Click at Day Tab
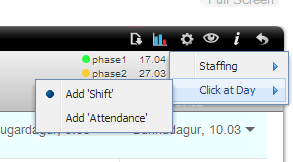
This option defines the one-click behavior for a day in the Time Calendar View. It enables you to add shift or attendance. |
 |
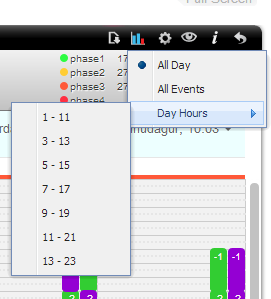
The View TabThis option defines the time period that appears in the Time Calendar view. It is possible to set up time period such as, 1-11, 3-13, 5-15, 7-17, 9-19, 11-21, and 13-23. |
 |
